Extract a table from JPG
Use a high-quality JPG when the table came from a camera or scanner. Heavy compression can blur small numbers and punctuation.
Upload or paste a JPG, PNG, WEBP, BMP, or screenshot. Picture2Txt proposes editable rows and columns, then lets you download the reviewed table as CSV or Excel.
Use a straight image with readable headers and consistent row or column alignment.
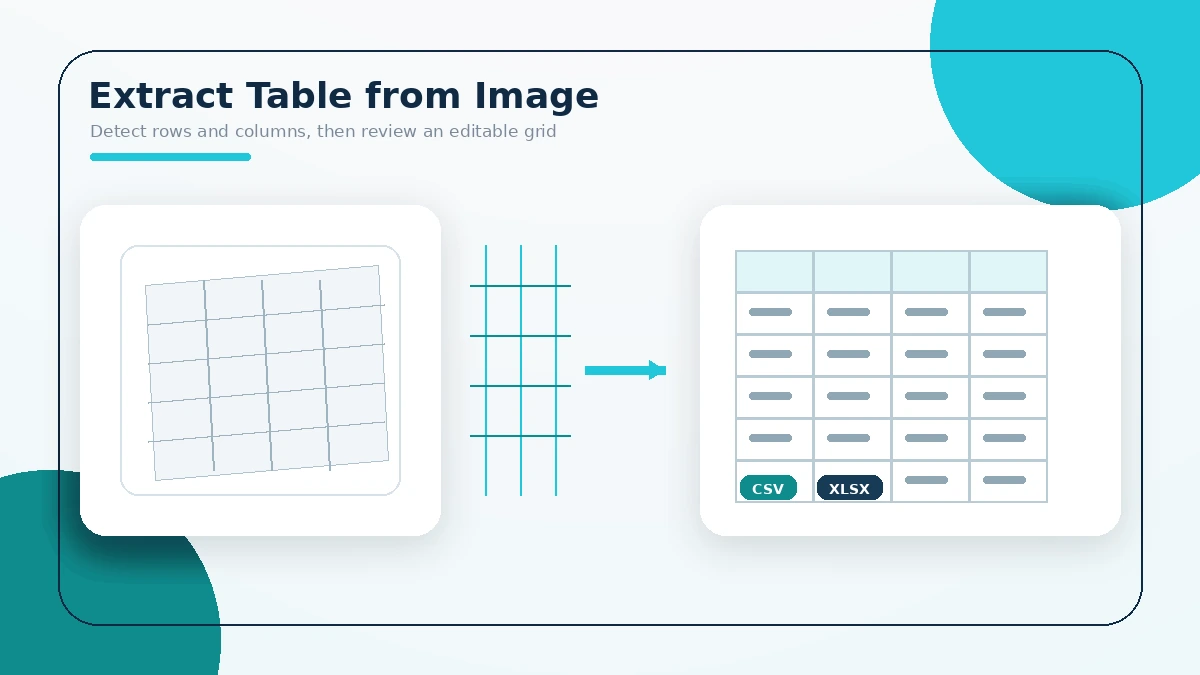
Upload a table screenshot, a high-quality JPG, or a sharp PNG. Keep the camera parallel to printed pages.
Choose the language model that matches the headers and cell text.
The browser recognizes words, groups lines into candidate rows, and estimates repeated column positions.
Fix merged columns, split values, add missing rows, and verify totals before export. If the first layout is wrong, set the expected column count or adjust cell-gap sensitivity and rebuild the grid without reading the image again.
The best input is the clearest one. File format matters less than readable text, straight rows, and stable spacing.
Use a high-quality JPG when the table came from a camera or scanner. Heavy compression can blur small numbers and punctuation.
PNG often keeps screenshot text and grid edges sharp. Transparent backgrounds can still reduce contrast if the viewer background changes.
Crop the screenshot to the grid. Remove toolbars and side panels so the table extraction engine sees fewer competing text regions.
The browser uses Tesseract.js to recognize words and their bounding boxes. Picture2Txt clusters nearby words into lines and uses recurring horizontal positions to propose columns.
This method works best with simple printed tables. It is not a full document-layout engine, so the editable grid is an informed draft rather than an exact copy.
CSV stores plain cell values in a widely supported text format. XLSX creates a spreadsheet workbook from the corrected grid. Both exports happen after you review the table.
The browser builds the files locally. MDN explains how browser applications can read user-selected files through the File API.
These short explanations cover common tasks, limits, and result-checking steps.
Yes. Upload a clear table image, start recognition, correct the proposed grid, and export the reviewed values.
Yes. The table extractor can recognize text in a JPG and propose rows and columns for manual correction.
Yes. PNG images often preserve sharp text and grid lines, which can help recognition when the source is clear.
Yes. After reviewing the grid, download the table as a CSV file directly in the browser.
Yes. The tool creates an XLSX workbook from the corrected cell values without a server export step.
Not reliably. Merged cells, nested headers, and complex spans usually need manual correction.
It uses recognized word positions more than visual borders. Clear alignment still improves row and column detection.
Yes. Correct the cells, then copy tab-separated table data for a spreadsheet or document.
The tool can infer columns from repeated text positions, but uneven spacing may merge or split cells.
Yes. Each cell remains editable before CSV or XLSX export.
Yes. Choose a fixed column count, adjust cell-gap sensitivity, and rebuild the current grid without rerunning text recognition.
Text recognition and spreadsheet export are designed to run inside the active browser workflow.
Yes. Verify totals, percentages, dates, decimal points, and currency values against the source image.
It recognizes words with bounding boxes, groups words into lines, and compares repeated horizontal positions to propose column boundaries.
Small gaps, perspective distortion, uneven alignment, faint text, or long cell content can make separate columns appear connected.
No. The workbook contains the corrected cell values. It does not reproduce exact fonts, colors, borders, formulas, or merged cells.
Use a straight, sharp image taken parallel to the table. Keep headers readable and avoid shadows, glare, and heavy compression.
Yes. Select an expected column count, adjust the cell-gap sensitivity, and rebuild the grid. Lower sensitivity splits cells more often, while higher sensitivity keeps nearby words together.
Yes. Download CSV or XLSX, then import the file into Google Sheets. Review the cell structure before using formulas or totals.